Live chart
A live line chart of memory use drawn into an RGBA bitmap.
Same example in PowerShell: Live chart
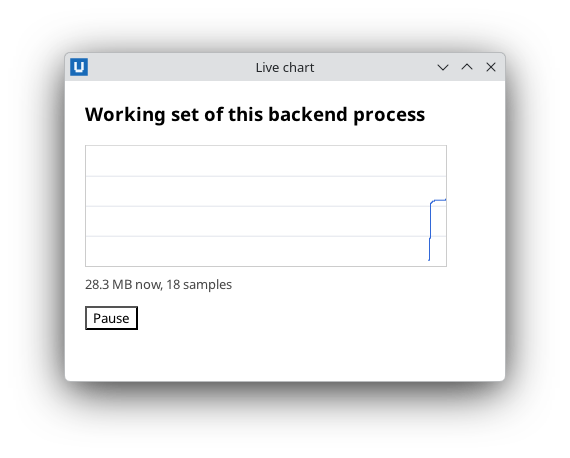
Real capture on KDE Plasma 6.6 Wayland with the released packages.
What it teaches: create_bitmap; RGBA frames; present from a background thread; pause.
Run it
uv init --app myapp && cd myapp    # once: a uv project for your app
uv add nativehtmlkit
# save the example file(s) in the project folder, then:
uv run live_chart.py
Related guide: live bitmaps
Source: live_chart.py
"""Live chart: a live line chart drawn into an RGBA bitmap.

What it teaches
  * ``Document.create_bitmap`` + ``<img src="nativehtmlkit-bitmap://ID">`` for pixels you render
  * the frame format: straight-alpha RGBA8, row-major, ``width * 4`` bytes per row
  * cheap rendering in pure Python: copy a prepared background, then draw short vertical spans
  * presenting frames from a background thread (``present``), sampling twice per second
  * pausing, and closing the bitmap (``close`` is idempotent)

The chart shows this Python process's working set (resident memory), sampled twice per second.

Run:  uv run live_chart.py
"""
from __future__ import annotations

import os
import sys
import threading

from nativehtmlkit import Application, NativeHTMLKitError, Window

WIDTH, HEIGHT = 360, 120
LINE = bytes((50, 104, 216, 255))

PAGE = f"""<!doctype html>
<html><head><style>
  body {{ font-family: system-ui, sans-serif; margin: 20px; }}
  img {{ width: {WIDTH}px; height: {HEIGHT}px; border: 1px solid #ccc; display: block; }}
  #legend {{ font-size: 13px; color: #444; margin-top: 8px; }}
</style></head>
<body>
  <h3>Working set of this backend process</h3>
  <img id="chart" src="nativehtmlkit-bitmap://memory" alt="Memory use over time">
  <p id="legend" role="status">Starting...</p>
  <button id="pause">Pause</button>
</body></html>"""


def working_set_mb() -> float:
    """Resident memory of this process in MB (Linux: /proc/self/statm; Windows: Win32 API)."""
    if sys.platform == "win32":
        import ctypes
        from ctypes import wintypes

        class Counters(ctypes.Structure):
            _fields_ = [("cb", wintypes.DWORD), ("PageFaultCount", wintypes.DWORD),
                        ("PeakWorkingSetSize", ctypes.c_size_t), ("WorkingSetSize", ctypes.c_size_t)] + [
                (name, ctypes.c_size_t) for name in ("QuotaPeakPagedPoolUsage", "QuotaPagedPoolUsage",
                                                     "QuotaPeakNonPagedPoolUsage", "QuotaNonPagedPoolUsage",
                                                     "PagefileUsage", "PeakPagefileUsage")]
        kernel32 = ctypes.WinDLL("kernel32")
        kernel32.GetCurrentProcess.restype = wintypes.HANDLE
        counters = Counters(cb=ctypes.sizeof(Counters))
        process = wintypes.HANDLE(kernel32.GetCurrentProcess())       # a pseudo-handle, no need to close
        kernel32.K32GetProcessMemoryInfo(process, ctypes.byref(counters), counters.cb)
        return counters.WorkingSetSize / 2**20
    with open("/proc/self/statm", encoding="ascii") as handle:
        return int(handle.read().split()[1]) * os.sysconf("SC_PAGE_SIZE") / 2**20


def draw_background() -> bytes:
    """White with grid lines at rows 30, 60 and 90; every frame starts as a copy of it."""
    frame = bytearray(b"\xff" * (WIDTH * HEIGHT * 4))
    grid = bytes((225, 229, 236, 255)) * WIDTH
    for y in (30, 60, 90):
        frame[y * WIDTH * 4:(y + 1) * WIDTH * 4] = grid
    return bytes(frame)


def render(samples: list[float], background: bytes) -> bytearray:
    """Newest sample at the right edge; the line is scaled to the visible minimum and maximum."""
    frame = bytearray(background)
    if not samples:
        return frame
    low, high = min(samples), max(samples)
    span = max(1.0, high - low)
    previous = None
    for i, value in enumerate(samples):
        x = WIDTH - len(samples) + i
        y = int((HEIGHT - 6) - ((value - low) / span) * (HEIGHT - 12))
        if previous is None:
            previous = y
        # A vertical span from the previous point keeps the line connected.
        for row in range(min(previous, y), max(previous, y) + 1):
            offset = (row * WIDTH + x) * 4
            frame[offset:offset + 4] = LINE
        previous = y
    return frame


class LiveChart:
    def __init__(self, window: Window):
        self.document = window.document
        # The bitmap belongs to this document; it is released with the document or by close().
        self.bitmap = self.document.create_bitmap("memory", WIDTH, HEIGHT)
        self.background = draw_background()
        self.samples: list[float] = []
        self.frames = 0
        self.paused = False
        self.stopped = threading.Event()
        self.document.on("click", lambda _event: self.toggle_pause(), element="pause")

    def add_sample(self) -> None:
        mb = working_set_mb()
        self.samples.append(mb)
        del self.samples[:-WIDTH]                         # at most one sample per pixel column
        self.document.set_text("legend", f"{mb:,.1f} MB now, {len(self.samples)} samples")

    def write_frame(self) -> dict:
        result = self.bitmap.present(render(self.samples, self.background))
        self.frames += 1
        return result

    def toggle_pause(self) -> None:
        self.paused = not self.paused
        self.document.set_text("pause", "Resume" if self.paused else "Pause")

    def start(self) -> threading.Thread:
        def tick() -> None:
            while not self.stopped.wait(0.5):
                if self.paused:
                    continue
                try:
                    self.add_sample()
                    self.write_frame()
                except (NativeHTMLKitError, RuntimeError):
                    return            # window closed / shutting down (a closed bitmap raises RuntimeError)
        thread = threading.Thread(target=tick, name="chart-tick", daemon=True)
        thread.start()
        return thread


def build(app: Application) -> LiveChart:
    chart = LiveChart(app.open_html(PAGE, title="Live chart", width=440, height=300))
    app.on_shutdown(chart.stopped.set)
    chart.add_sample()
    chart.write_frame()
    return chart


def main() -> None:
    with Application.start(name="Live chart") as app:
        build(app).start()
        app.run()


if __name__ == "__main__":
    main()